|
Size: 1552
Comment:
|
Size: 4481
Comment:
|
| Deletions are marked like this. | Additions are marked like this. |
| Line 4: | Line 4: |
| Note: all of the source code can be found on the "dmri" branch on the Freesurfer Github page. The link can be found here: https://github.com/freesurfer/freesurfer/tree/dmri/anatomicuts | Note: all of the source code can be found on the "dmri" branch on the Freesurfer Github page. The link can be found here: |
| Line 6: | Line 6: |
| '''Index''' [[Table of Contents(2)]] |
https://github.com/freesurfer/freesurfer/tree/dmri/anatomicuts |
| Line 9: | Line 8: |
| == How to Use == | {{TableOfContents(1)}} |
| Line 11: | Line 10: |
| Usage: ./runProject.sh <Patient File> <OPTION: DTI> |
== How to Run == |
| Line 14: | Line 12: |
| DTI is an option that allows more metrics about the FA values to be outputted, however the required files must be in the proper location. Check file requirements below. | ''''' Note by running the executable with no parameters will also give information on how to run the program ''''' |
| Line 16: | Line 14: |
| === File System Requirements === | === Main Bundle Analysis Program === |
| Line 18: | Line 16: |
| Requires a subject's file to look like this: | Usage: ./bundleAnalysis.sh <Patient File> <OPTION: DTI> |
| Line 20: | Line 18: |
| EXAMPLES OF THE FILE SYSTEM | DTI is an option that allows more metrics about the FA values to be outputted based on 4 volumes |
| Line 22: | Line 20: |
| For DTI, the folder must look like this: | This program runs both dmri_groupByEndpoints and dmri_extractSurfaceMeasurements and the outputs will be under its respective section below |
| Line 24: | Line 22: |
| EXAMPLES OF THE DTI FILE | '' If specific files are wanted to be used or files cannot be found, run the programs individually (read below) '' |
| Line 26: | Line 24: |
| ''''' Please note that the file names are case sensitive for the surface and volumes ''''' | === Individually === |
| Line 28: | Line 26: |
| == Output == | ==== Group by Endpoints ==== |
| Line 30: | Line 28: |
| In the terminal, it will output all of the file names that it will be using. | Usage: ./dmri_groupByEndpoints -s <streamlineFile> -i <imageFile> -d <outputDirectory> |
| Line 32: | Line 30: |
| Example: | The program will take in a streamline file and an image file, cluster the streamlines based on location, and output TRK files to the output directory |
| Line 34: | Line 32: |
| EXAMPLE OF TERMINAL OUTPUT | ===== Output ===== |
| Line 36: | Line 34: |
| Also, within the dmri.ac file, there will be a folder named u-shape. Within that folder will contain two folders, clusters and measures. The clusters folder will contain TRK files and be named after the region that the u-shape fibers connect. | The output directory will be filled with TRK files. Each TRK file will be labeled with the name of the region and each will be filled with streamlines that begin and end within it. See below: |
| Line 38: | Line 36: |
| EXAMPLE OF USHAPE FOLDER AND CLUSTERS FOLDER | {{attachment:Clustered Streamlines.png||width="500",height="350"}} {{attachment:Clustered Streamlines 2.png||width="500",height="350"}} |
| Line 40: | Line 38: |
| The measures folder will contain CSV files with the thickness and curvature at the start and end points of a streamline. If the option DTI was used, it will include the mean FA and standard deviation for the 4 files. | ==== Extract Surface Measurements ==== |
| Line 42: | Line 40: |
| EXAMPLE OF THE CSV FILE, ONE WITH DTI ONE WITHOUT DTI | Usage: ./dmri_extractSurfaceMeasurements -i <streamlineFile(s)> -sl <Left Hemisphere Surface> -tl <Left Thickness File> -cl <Left Curvature File> -sr <Right Hemisphere Surface> -tr <Right Thickness File> -cl <Right Curvature File> -o <outputDirectory> OPTIONAL FLAG: -fa <number of Measures> <Given Name 1> <File 1> ... <Given Name X> <File X> The program will take in streamlines, a full brain surface with overlay files, an output directory, and possibly image files, and will output surface metrics, such as thickness and curvature as well as FA at the endpoints of the streamlines ===== Output ===== The output directory will be filled with CSV files. Each CSV file will be labeled with the name of the region and each will contain numerous metrics, such as thickness and curvature. If the -fa flag is used, an addition 2 or more column will contain the mean FA and standard deviation. See below: '''WITH -FA FLAG''' {{attachment:CSV.png||width="950",height="400"}} '''WITHOUT FLAG''' {{attachment:CSV_noFA.png||width="500",height="400"}} === Additional Programs === ==== Change Endpoints ==== Usage: ./dmri_changeEndpoints -i <streamlineFile> -sl <Left Hemisphere Surface> -sr <Right Hemisphere Surface> -ol <Left Overlay Filename> -or <Right Overlay Filename> -itk <Itk Volume File> -fs <FS Volume File> The program will take in two volumes, a streamline, a surface, and the names of the overlay file that will be created. It will assign the endpoints of the streamline to a set number (usually a value of 1, but can be changed by adjusting the value of the variable at the top) ===== Output ===== The new overlay files will be created in the same directory with the name that it was passed with. The overlay files will be completely blank (values are zero) besides the points near the beginning and end of the streamline passed in, which will have a value that was set before it was run. See below: {{attachment:Endpoints.png||width="650",height="350"}} ==== Plots ==== Usage: python3 ./dmri_plots.py <inputDirectory> <Grouping CSV> <Structure Name> The program will take in an input directory containing the subjects as subdirectories, a CSV file that divides the subjects into groups, and the name of a structure. For every subject, multiple violin plots are created to organize the data from every column of the structure's CSV file. The plot will be further explained below. ===== Output ===== The output will be a number of violin plots based on the amount of value types. In the data, each group is represented by 2 violin plots, one for both the left and right halves. For example, on the left half, these two violins represent the left and right hemisphere of group 1, while the other two represent the left and right hemisphere of group 2. See below: {{attachment:Violin Plot.png||width="1250",height="300"}} |
U-Shape Bundle Analysis
Note: all of the source code can be found on the "dmri" branch on the Freesurfer Github page. The link can be found here:
https://github.com/freesurfer/freesurfer/tree/dmri/anatomicuts
How to Run
Note by running the executable with no parameters will also give information on how to run the program
Main Bundle Analysis Program
Usage: ./bundleAnalysis.sh <Patient File> <OPTION: DTI>
DTI is an option that allows more metrics about the FA values to be outputted based on 4 volumes
This program runs both dmri_groupByEndpoints and dmri_extractSurfaceMeasurements and the outputs will be under its respective section below
If specific files are wanted to be used or files cannot be found, run the programs individually (read below)
Individually
Group by Endpoints
Usage: ./dmri_groupByEndpoints -s <streamlineFile> -i <imageFile> -d <outputDirectory>
The program will take in a streamline file and an image file, cluster the streamlines based on location, and output TRK files to the output directory
Output
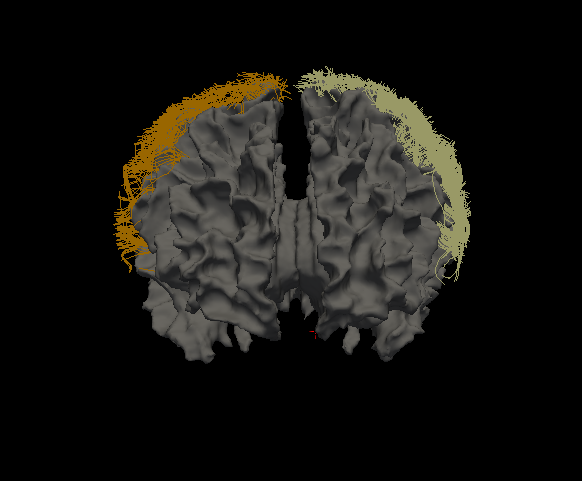
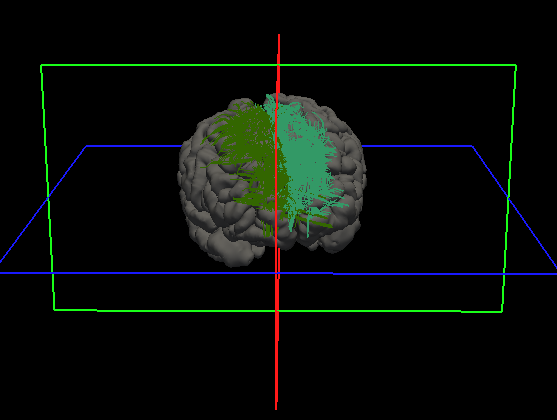
The output directory will be filled with TRK files. Each TRK file will be labeled with the name of the region and each will be filled with streamlines that begin and end within it. See below:
Extract Surface Measurements
Usage: ./dmri_extractSurfaceMeasurements -i <streamlineFile(s)> -sl <Left Hemisphere Surface> -tl <Left Thickness File> -cl <Left Curvature File> -sr <Right Hemisphere Surface> -tr <Right Thickness File> -cl <Right Curvature File> -o <outputDirectory>
OPTIONAL FLAG: -fa <number of Measures> <Given Name 1> <File 1> ... <Given Name X> <File X>
The program will take in streamlines, a full brain surface with overlay files, an output directory, and possibly image files, and will output surface metrics, such as thickness and curvature as well as FA at the endpoints of the streamlines
Output
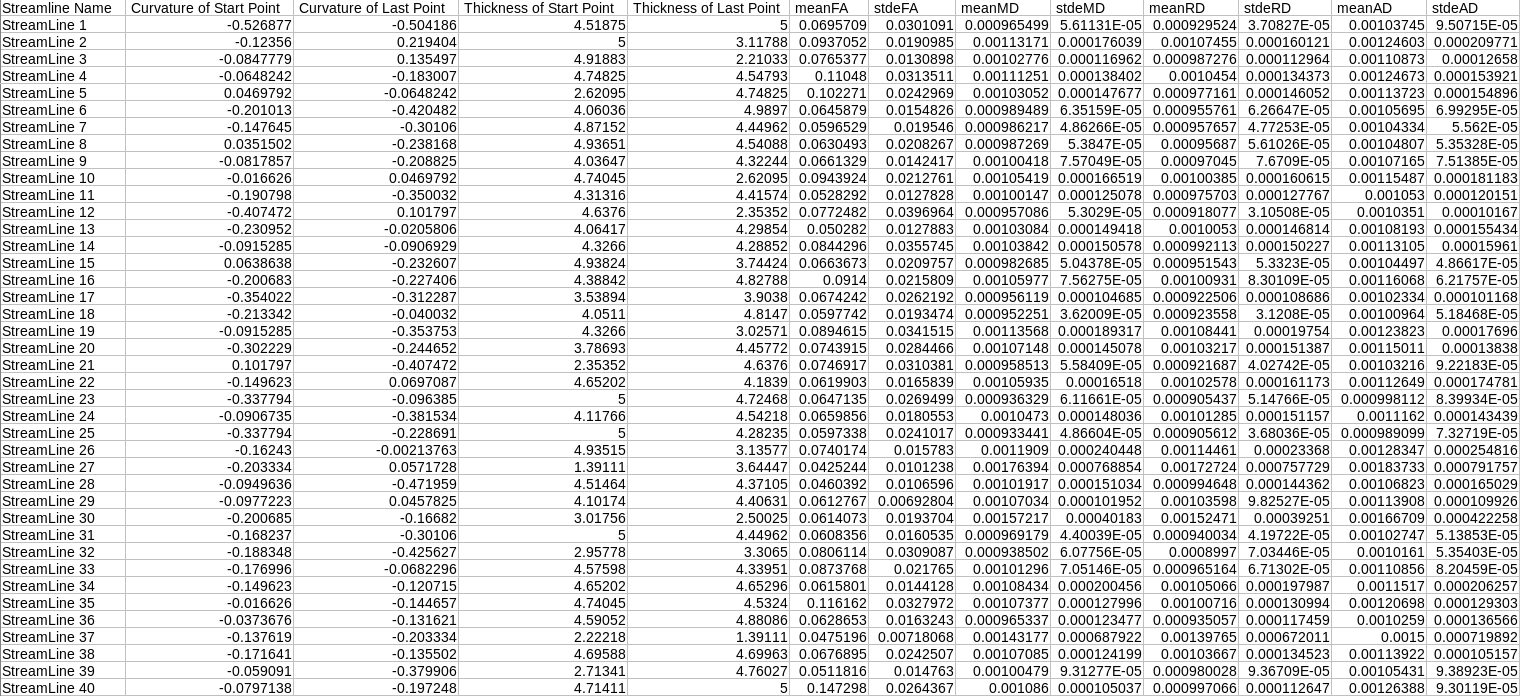
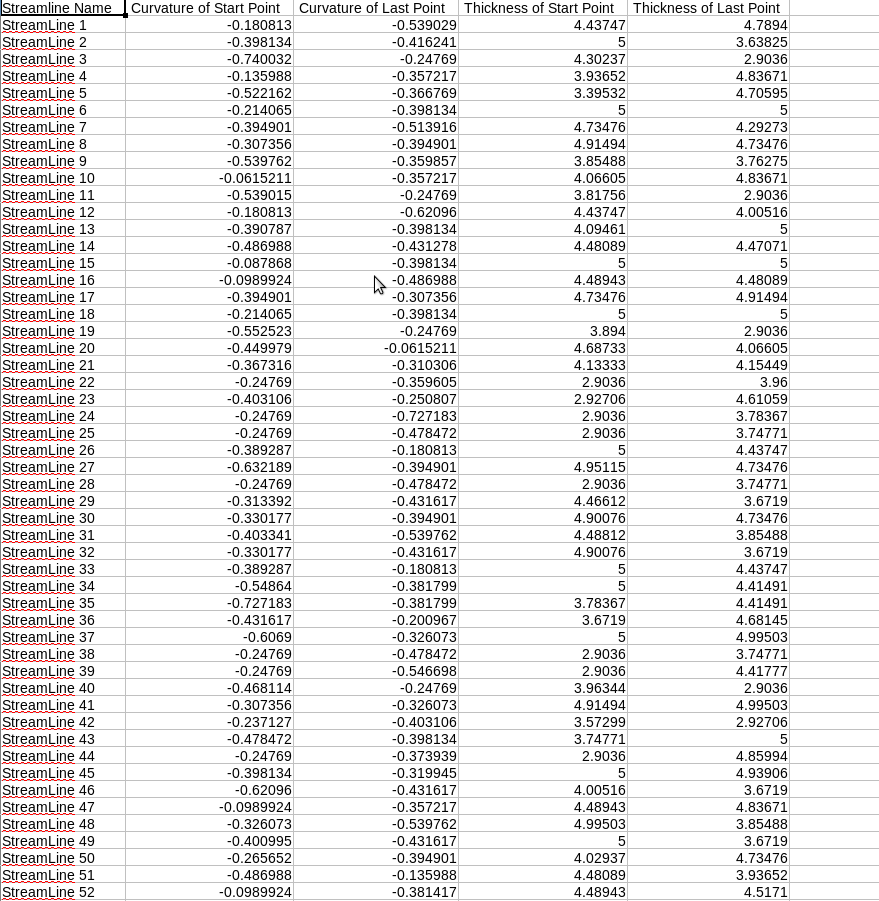
The output directory will be filled with CSV files. Each CSV file will be labeled with the name of the region and each will contain numerous metrics, such as thickness and curvature. If the -fa flag is used, an addition 2 or more column will contain the mean FA and standard deviation. See below:
WITH -FA FLAG
WITHOUT FLAG
Additional Programs
Change Endpoints
Usage: ./dmri_changeEndpoints -i <streamlineFile> -sl <Left Hemisphere Surface> -sr <Right Hemisphere Surface> -ol <Left Overlay Filename> -or <Right Overlay Filename> -itk <Itk Volume File> -fs <FS Volume File>
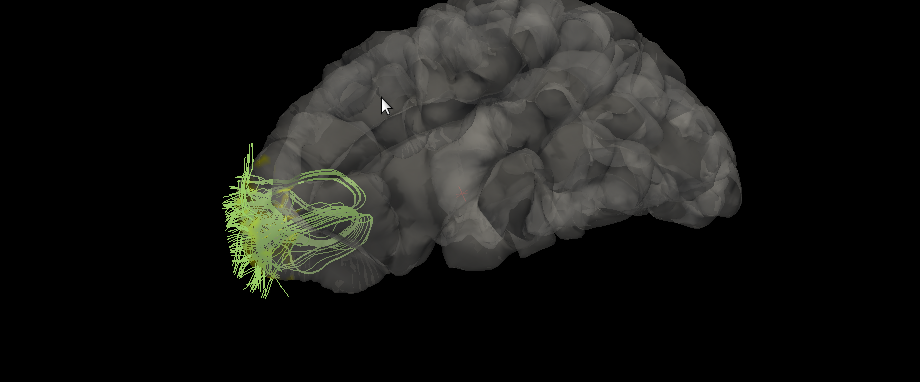
The program will take in two volumes, a streamline, a surface, and the names of the overlay file that will be created. It will assign the endpoints of the streamline to a set number (usually a value of 1, but can be changed by adjusting the value of the variable at the top)
Output
The new overlay files will be created in the same directory with the name that it was passed with. The overlay files will be completely blank (values are zero) besides the points near the beginning and end of the streamline passed in, which will have a value that was set before it was run. See below:
Plots
Usage: python3 ./dmri_plots.py <inputDirectory> <Grouping CSV> <Structure Name>
The program will take in an input directory containing the subjects as subdirectories, a CSV file that divides the subjects into groups, and the name of a structure. For every subject, multiple violin plots are created to organize the data from every column of the structure's CSV file. The plot will be further explained below.
Output
The output will be a number of violin plots based on the amount of value types. In the data, each group is represented by 2 violin plots, one for both the left and right halves. For example, on the left half, these two violins represent the left and right hemisphere of group 1, while the other two represent the left and right hemisphere of group 2. See below:
