|
Size: 10904
Comment:
|
Size: 11302
Comment:
|
| Deletions are marked like this. | Additions are marked like this. |
| Line 1: | Line 1: |
| [[FsTutorial|Back to Top Tutorial Page]] <<BR>> [[FsTutorial/MultiModal_freeview|Back to Multimodal Top]]<<BR>> The purpose of this tutorial is to get you acquainted with the concepts need to perform fMRI integration in FreeSurfer by interacting with the data from several subjects in a group analysis. You will not learn how to perform fMRI analysis here; that knowledge is already assumed. This tutorial also does not assume any particular directory structure (as would happen in FS-FAST). This tutorial makes use of data from the Functional Biomedical Informatics Research Network (fBIRN, [[http://www.nbirn.net|www.nbirn.net]]).<<BR>> Other multimodal tutorials: [[FsTutorial/MultiModalRegistration_freeview|A. Multimodal Registration]], [[FsTutorial/MultiModalFmriIndividual_freeview|B. Individual fMRI Integration]], [[FsTutorial/MultiModalDtiIndividual_freeview|D. Individual DTI Integration]] <<BR>> <<TableOfContents>> |
[[FsTutorial|Back to Top Tutorial Page]] <<BR>> [[FsTutorial/MultiModal_freeview|Back to Multimodal Top]] Other multimodal tutorials: [[FsTutorial/MultiModalRegistration_freeview|A. Multimodal Registration]], [[FsTutorial/MultiModalDtiIndividual_freeview|B. Individual DTI Integration]], [[FsTutorial/MultiModalFmriIndividual_freeview|C. Individual fMRI Integration]] The purpose of this tutorial is to get you acquainted with the concepts needed to perform fMRI integration in !FreeSurfer by interacting with the data from several subjects in a group analysis. You will not learn how to perform fMRI analysis here; that knowledge is already assumed. This tutorial also does not assume any particular directory structure (as would happen in FS-FAST). This tutorial makes use of data from the Functional Biomedical Informatics Research Network (fBIRN, [[http://www.nbirn.net|www.nbirn.net]]).<<BR>><<BR>> <<TableOfContents(1)>> |
| Line 17: | Line 8: |
| In fMRI, stimuli are presented to a subject, which creates a BOLD hemodynamic response function (HRF) in certain areas of the brain. The analysis is performed by first performing motion correction, then correlating each voxel's time course with the stimulus schedule convolved with an assumed HRF shape. The result is an estimate of the HRF amplitude for each condition at each voxel, contrasts of the HRF amplitudes of various conditions, the variance of this contrast, and some measure of the significance (eg, p, t, F, or z) map. All these maps are aligned with the motion correction template, which should be used as the registration template. == Preparations == |
In fMRI, stimuli are presented to a subject, which creates a BOLD hemodynamic response function (HRF) in certain areas of the brain. The analysis is performed by first performing motion correction, then correlating each voxel's time course with the stimulus schedule convolved with an assumed HRF shape. The result is an estimate of the HRF amplitude for each condition at each voxel, contrasts of the HRF amplitudes of various conditions, the variance of this contrast, and some measure of the significance (eg, p, t, F, or z) map. All these maps are aligned with the motion correction template, which should be used as the registration template. = Preparations = |
| Line 30: | Line 13: |
| Line 34: | Line 18: |
| ''To copy: Highlight the command in the box above, right click and select copy (or use keyboard shortcut Ctrl+c), then use the middle button of your mouse to click inside the terminal window (this will paste the command). Press enter to run the command.'' These two commands set the SUBJECTS_DIR variable to the directory where the data is stored and then navigates into this directory. You can now skip ahead to the tutorial (below the gray line). |
''To copy: Highlight the command in the box above, right click and select copy (or use keyboard shortcut Ctrl+c), then use the middle button of your mouse to click inside the terminal window (this will paste the command). Press enter to run the command.'' These two commands set the SUBJECTS_DIR variable to the directory where the data is stored and then navigates into this directory. You can now skip ahead to the tutorial (below the gray line). |
| Line 38: | Line 22: |
| Line 45: | Line 30: |
| Line 46: | Line 32: |
| There are five subjects from the fBIRN Phase I acquisition. They are fbirn-10?, where "?" is 1, 3, 4, 5, 6 (note that #2 is missing). Each has a FreeSurfer reconstruction by the name fbirn-anat-10?.v4. The [[FsTutorial/MultiModalRegistration| individual registration]] [[FsTutorial/MultiModalFmriIndividual|ROI Analysis]] have already been performed on all subjects. The data are the results from a sensorimotor paradigm (flashing checkerboard, audible tone, and finger tapping). The raw fMRI data were motion corrected but not smoothed. Each subject has four volumes: |
There are five subjects from the fBIRN Phase I acquisition. They are fbirn-10?, where "?" is 1, 3, 4, 5, 6 (note that #2 is missing). Each has a !FreeSurfer reconstruction by the name fbirn-anat-10?.v4. The [[FsTutorial/MultiModalRegistration_freeview|individual registration]] [[FsTutorial/MultiModalFmriIndividual_freeview|ROI Analysis]] have already been performed on all subjects. The data are the results from a sensorimotor paradigm (flashing checkerboard, audible tone, and finger tapping). The raw fMRI data were motion corrected but not smoothed. Each subject has four volumes: ||template.nii ||motion correction template || ||ces.nii ||contrast effect size || ||cesvar.nii ||variance of contrast effect size || ||sig.nii ||signed significance of contrast (-log10(p)) || The contrast is the contrast between the ON and the OFF of the stimulus paradigm (ie, a comparison against baseline). The sig.nii volume has signed -log10(p) values. So, if the p-value = .01, -log10(p) = 2. If the contrast was positive, then the value would be +2, if negative (ie, ON<OFF), then the value would be -2. = Check Registration = First (and always), check the registration (see the [[FsTutorial/MultiModalRegistration_freeview|Registration Tutorial]] for more information). This registration should already be good, so there is no need to make any modifications. In a real analysis, you should check the registrations for all subjects, but that is not necessary here. '''Option A''': Using !FreeView |
| Line 57: | Line 49: |
| template.nii - motion correction template ces.nii - contrast effect size cesvar.nii - variance of contrast effect size sig.nii - signed significance of contrast (-log10(p)) |
freeview -v $SUBJECTS_DIR/fbirn-anat-101.v4/mri/orig.mgz \ fbirn-101/template.nii:reg=bb.register.lta -f \ $SUBJECTS_DIR/fbirn-anat-101.v4/surf/lh.white:edgecolor=green \ $SUBJECTS_DIR/fbirn-anat-101.v4/surf/rh.white:edgecolor=green \ -viewport coronal |
| Line 62: | Line 55: |
| The contrast is the contrast between the ON and the OFF (ie, a comparison against baseline). The sig.nii volume has signed -log10(p) values. So, if the p-value = .01, -log10(p) = 2. If the contrast was positive, then the value would be +2, if negative (ie, ON<OFF), then the value would be -2. = Check Registration = First (and always), check the registration (see the [[FsTutorial/MulitModalRegistration|Registration Tutorial]] for more information). ---- |
Use Alt+v to toggle between the template and the orig, using the surfaces as a guide to make sure they are aligned. '''Option B''': Using tkregister2 |
| Line 76: | Line 63: |
| ---- This registration should already be good, so there is no need to make any modifications. In a real analysis, you should check the registrations for all subjects, but that is not necessary here. = Surface-based Group fMRI Analysis = |
== Surface-based Group fMRI Analysis == |
| Line 82: | Line 65: |
| 1. Assemble data 1. Spatially smooth data on surface (if desired) 1. GLM Analysis |
1. Assemble data 1. Spatially smooth data on surface (if desired) 1. GLM Analysis |
| Line 86: | Line 71: |
| Only the first step is different than an anatomical (eg, thickness) analysis. Still, you run mri_preproc, but with different arguments: ---- |
Only the first step is different than an anatomical (eg, thickness) analysis. Still, you run mris_preproc, but with different arguments: |
| Line 91: | Line 75: |
| --iv fbirn-101/ces.nii fbirn-101/bb.register.dat \ --iv fbirn-103/ces.nii fbirn-103/bb.register.dat \ --iv fbirn-104/ces.nii fbirn-104/bb.register.dat \ --iv fbirn-105/ces.nii fbirn-105/bb.register.dat \ --iv fbirn-106/ces.nii fbirn-106/bb.register.dat \ |
--iv fbirn-101/ces.nii fbirn-101/bb.register.lta \ --iv fbirn-103/ces.nii fbirn-103/bb.register.lta \ --iv fbirn-104/ces.nii fbirn-104/bb.register.lta \ --iv fbirn-105/ces.nii fbirn-105/bb.register.lta \ --iv fbirn-106/ces.nii fbirn-106/bb.register.lta \ |
| Line 99: | Line 83: |
| ---- | |
| Line 101: | Line 84: |
| 1. The target surface is the left hemisphere of fsaverage 1. Each input volume and corresponding registration is listed separately 1. The fMRI data are sampled half-way between the white and pial surfaces ("--projfrac 0.5"). The output is lh.ces.mgh. It has the same size as any other surface overlay for fsaverage eg, lh.thickness. To see it's dimensions, run: ---- |
1. The target surface is the left hemisphere of fsaverage. 1. Each input volume and corresponding registration is listed separately. 1. The fMRI data are sampled half-way between the white and pial surfaces ("--projfrac 0.5"). The output is lh.ces.mgh. It has the same size as any other surface overlay for fsaverage eg, lh.thickness. To see its dimensions, run: |
| Line 110: | Line 94: |
| ---- You will see "dimensions: 163842 x 1 x 1 x 5", indicating that there are 163842 "columns" (ie, vertices), 1 "row", and 1 "slice". There are 5 frames, one for each subject. |
You will see "dimensions: 163842 x 1 x 1 x 5", indicating that there are 163842 "columns" (ie, vertices), 1 "row", and 1 "slice". There are 5 frames, one for each subject. |
| Line 115: | Line 97: |
| ---- | |
| Line 120: | Line 101: |
| ---- | |
| Line 122: | Line 102: |
| 1. Full-Width/Half-Max (fwhm) is 5 mm 1. The smoothing is only perform in regions of legitimate cortex (--cortex, which uses the lh.cortex.label). |
1. Full-Width/Half-Max (fwhm) is 5 mm. 1. The smoothing is only performed in regions of legitimate cortex (--cortex, which uses the lh.cortex.label). |
| Line 126: | Line 108: |
| ---- | |
| Line 131: | Line 113: |
| ---- ---- |
|
| Line 134: | Line 114: |
| freeview -f $SUBJECTS_DIR/fsaverage/surf/lh.inflated:annot=aparc.annot:overlay=lh.ces.sm05.osgm/osgm/sig.mgh:overlay_threshold=2,5 | freeview -f \ $SUBJECTS_DIR/fsaverage/surf/lh.inflated:annot=aparc.annot:annot_outline=1:overlay=lh.ces.sm05.osgm/osgm/sig.mgh:overlay_threshold=2,5 \ -viewport 3d |
| Line 136: | Line 118: |
| ---- Once the aparc is loaded, click the '''Show outline only''' checkbox to see the significance map. |
{{attachment:glmfit_fv.jpg||height="370",width="518"}} {{attachment:glmfitmed_fv.jpg||height="369",width="553"}} |
| Line 139: | Line 120: |
| {{attachment:glmfit_fv.jpg}} {{attachment:glmfitmed_fv.jpg}} Note that the activation is light because there are only five subjects, but the activation that is there is in the right place. |
Note that the activation is light because there are only five subjects, but the activation that is there is in the right place. |
| Line 143: | Line 123: |
| The purpose of this tutorial is to combine individual stats files into one summary table file that can be loaded into a spreadsheet program such as excel or oocalc. The individual ROI analyses were performed as described in the [[FsTutorial/MulitModalFmriIndividual|Individual fMRI Integration Tutorial]]. Namely, stats files were created by mri_segstats using no functional contraint, an unsigned (abs) constraint, and a positive (pos) constraint to create stats files in each directory. Furthermore, only 4 segmentations were summarized: 1. 1021=ctx-lh-pericalcarine 1. 1022=ctx-lh-postcentral 1. 1030=ctx-lh-superiortemporal 1. 17=Left-Hippocampus |
The purpose of this tutorial is to combine individual stats files into one summary table file that can be loaded into a spreadsheet program such as MS Excel or OpenOffice Calc. The individual ROI analyses were performed as described in the [[FsTutorial/MultiModalFmriIndividual_freeview|Individual fMRI Integration Tutorial]]. Namely, stats files were created by mri_segstats using no functional contraint, an unsigned (abs) constraint, and a positive (pos) constraint to create stats files in each directory. Furthermore, only 4 segmentations were summarized: ||1021 ||ctx-lh-pericalcarine || ||1022 ||ctx-lh-postcentral || ||1030 ||ctx-lh-superiortemporal || ||17 ||Left-Hippocampus || |
| Line 154: | Line 133: |
| ---- | |
| Line 165: | Line 143: |
| ---- Click [[FsTutorial/MultiModalFmriIndividual/BbStats#head-ddb7dd6be9b64b6a490cc20e619cb715e59f4721|here]] to see the output (ces.pos-masked.vol.stats). Notes: 1. The values are the volume in mm3 of the ON>OFF voxels whose pvalues < .01. 1. The value first column is just the row number (starting from 0). Normally, the subject name would be here, but the subject name is not input to the command above. |
Click [[FsTutorial/MultiModalFmriIndividual/BbStats#ces.pos-masked.vol.stats|here]] to see the output (ces.pos-masked.vol.stats). Notes: 1. The values are the volume in mm3 of the ON>OFF voxels whose p-values < .01. 1. The value in the first column is just the row number (starting from 0). Normally, the subject name would be here, but the subject name was not specified as input in the above command. |
| Line 171: | Line 149: |
| ---- | |
| Line 182: | Line 159: |
| ---- Click [[FsTutorial/MultiModalFmriIndividual/BbStats#head-ddb7dd6be9b64b6a490cc20e619cb715e59f4721|here]] to see the output (ces.abs-masked.mean.stats). Notes: 1. The values are the mean HRF values (raw MR units) of the ON>OFF or ON<OFF voxels whose pvalues < .01. 1. Some of the values are negative. This is possible because the mask is unsigned (abs). 1. In particular, the cross-subject average of Left-Hippocampus is near 0. This is expected because the sensorimotor task should not activate hippocampus. |
Click [[FsTutorial/MultiModalFmriIndividual/BbStats#ces.abs-masked.mean.stats|here]] to see the output (ces.abs-masked.mean.stats). Notes: 1. The values are the mean HRF values (raw MR units) of the ON>OFF or ON<OFF voxels whose p-values < .01. 1. Some of the values are negative. This is possible because the mask is unsigned (abs). 1. In particular, the cross-subject average of Left-Hippocampus is near 0. This is expected because the sensorimotor task should not activate hippocampus. |
| Line 189: | Line 166: |
| ---- | |
| Line 200: | Line 176: |
| ---- Click [[FsTutorial/MultiModalFmriIndividual/BbStats#head-ddb7dd6be9b64b6a490cc20e619cb715e59f4721|here]] to see the output (ces.pos-masked.mean.stats). Notes: 1. The values are the mean HRF values (raw MR units) of the ON>OFF voxels whose pvalues < .01. 1. NONE of the values are negative. This is because the mask is positive (pos). 1. In particular, the cross-subject average of Left-Hippocampus is NOT close to 0 because only positive values were chosen. So, one must be careful how to interpret and draw conclusions from these numbers.<<BR>> Other multimodal tutorials: [[FsTutorial/MultiModalRegistration_freeview|A. Multimodal Registration]], [[FsTutorial/MultiModalFmriIndividual_freeview|B. Individual fMRI Integration]], [[FsTutorial/MultiModalDtiIndividual_freeview|D. Individual DTI Integration]] <<BR>> |
Click [[FsTutorial/MultiModalFmriIndividual/BbStats#ces.pos-masked.mean.stats|here]] to see the output (ces.pos-masked.mean.stats). Notes: 1. The values are the mean HRF values (raw MR units) of the ON>OFF voxels whose p-values < .01. 1. NONE of the values are negative. This is because the mask is positive (pos). 1. In particular, the cross-subject average of Left-Hippocampus is NOT close to 0 because only positive values were chosen. So, one must be careful how to interpret and draw conclusions from these numbers.<<BR>> Other multimodal tutorials: [[FsTutorial/MultiModalRegistration_freeview|A. Multimodal Registration]], [[FsTutorial/MultiModalDtiIndividual_freeview|B. Individual DTI Integration]], [[FsTutorial/MultiModalFmriIndividual_freeview|C. Individual fMRI Integration]] <<BR>> |
Back to Top Tutorial Page
Back to Multimodal Top
Other multimodal tutorials: A. Multimodal Registration, B. Individual DTI Integration, C. Individual fMRI Integration
The purpose of this tutorial is to get you acquainted with the concepts needed to perform fMRI integration in FreeSurfer by interacting with the data from several subjects in a group analysis. You will not learn how to perform fMRI analysis here; that knowledge is already assumed. This tutorial also does not assume any particular directory structure (as would happen in FS-FAST). This tutorial makes use of data from the Functional Biomedical Informatics Research Network (fBIRN, www.nbirn.net).
fMRI Basics
In fMRI, stimuli are presented to a subject, which creates a BOLD hemodynamic response function (HRF) in certain areas of the brain. The analysis is performed by first performing motion correction, then correlating each voxel's time course with the stimulus schedule convolved with an assumed HRF shape. The result is an estimate of the HRF amplitude for each condition at each voxel, contrasts of the HRF amplitudes of various conditions, the variance of this contrast, and some measure of the significance (eg, p, t, F, or z) map. All these maps are aligned with the motion correction template, which should be used as the registration template.
Preparations
If You're at an Organized Course
If you are taking one of the formally organized courses, everything has been set up for you on the provided laptop. The only thing you will need to do is run the following commands in every new terminal window (aka shell) you open throughout this tutorial. Copy and paste the commands below to get started:
setenv SUBJECTS_DIR $TUTORIAL_DATA/buckner_data/tutorial_subjs
cd $SUBJECTS_DIR/multimodal/fmri
To copy: Highlight the command in the box above, right click and select copy (or use keyboard shortcut Ctrl+c), then use the middle button of your mouse to click inside the terminal window (this will paste the command). Press enter to run the command. These two commands set the SUBJECTS_DIR variable to the directory where the data is stored and then navigates into this directory. You can now skip ahead to the tutorial (below the gray line).
If You're not at an Organized Course
If you are NOT taking one of the formally organized courses, then to follow this exercise exactly be sure you've downloaded the tutorial data set before you begin. If you choose not to download the data set you can follow these instructions on your own data, but you will have to substitute your own specific paths and subject names. These are the commands that you need to run before getting started:
tcsh
source your_freesurfer_dir/SetUpFreeSurfer.csh
setenv SUBJECTS_DIR $TUTORIAL_DATA/buckner_data/tutorial_subjs
cd $SUBJECTS_DIR/multimodal/fmri
Notice the command to open tcsh. If you are already running the tcsh command shell, then the 'tcsh' command is not necessary. If you are not using the tutorial data you should set your SUBJECTS_DIR to the directory in which the recon(s) of the subject(s) you will use for this tutorial are located.
There are five subjects from the fBIRN Phase I acquisition. They are fbirn-10?, where "?" is 1, 3, 4, 5, 6 (note that #2 is missing). Each has a FreeSurfer reconstruction by the name fbirn-anat-10?.v4. The individual registration ROI Analysis have already been performed on all subjects. The data are the results from a sensorimotor paradigm (flashing checkerboard, audible tone, and finger tapping). The raw fMRI data were motion corrected but not smoothed. Each subject has four volumes:
template.nii |
motion correction template |
ces.nii |
contrast effect size |
cesvar.nii |
variance of contrast effect size |
sig.nii |
signed significance of contrast (-log10(p)) |
The contrast is the contrast between the ON and the OFF of the stimulus paradigm (ie, a comparison against baseline). The sig.nii volume has signed -log10(p) values. So, if the p-value = .01, -log10(p) = 2. If the contrast was positive, then the value would be +2, if negative (ie, ON<OFF), then the value would be -2.
Check Registration
First (and always), check the registration (see the Registration Tutorial for more information). This registration should already be good, so there is no need to make any modifications. In a real analysis, you should check the registrations for all subjects, but that is not necessary here.
Option A: Using FreeView
freeview -v $SUBJECTS_DIR/fbirn-anat-101.v4/mri/orig.mgz \
fbirn-101/template.nii:reg=bb.register.lta -f \
$SUBJECTS_DIR/fbirn-anat-101.v4/surf/lh.white:edgecolor=green \
$SUBJECTS_DIR/fbirn-anat-101.v4/surf/rh.white:edgecolor=green \
-viewport coronal
Use Alt+v to toggle between the template and the orig, using the surfaces as a guide to make sure they are aligned.
Option B: Using tkregister2
tkregister2 --mov fbirn-101/template.nii \
  --reg fbirn-101/bb.register.dat --surf
Surface-based Group fMRI Analysis
The group analysis is done in three stages:
- Assemble data
- Spatially smooth data on surface (if desired)
- GLM Analysis
Assemble Data
Only the first step is different than an anatomical (eg, thickness) analysis. Still, you run mris_preproc, but with different arguments:
mris_preproc --target fsaverage --hemi lh \
  --iv  fbirn-101/ces.nii fbirn-101/bb.register.lta \
  --iv  fbirn-103/ces.nii fbirn-103/bb.register.lta \
  --iv  fbirn-104/ces.nii fbirn-104/bb.register.lta \
  --iv  fbirn-105/ces.nii fbirn-105/bb.register.lta \
  --iv  fbirn-106/ces.nii fbirn-106/bb.register.lta \
  --projfrac 0.5 \
  --out lh.ces.mgh
Notes:
- The target surface is the left hemisphere of fsaverage.
- Each input volume and corresponding registration is listed separately.
- The fMRI data are sampled half-way between the white and pial surfaces ("--projfrac 0.5").
The output is lh.ces.mgh. It has the same size as any other surface overlay for fsaverage eg, lh.thickness. To see its dimensions, run:
mri_info lh.ces.mgh
You will see "dimensions: 163842 x 1 x 1 x 5", indicating that there are 163842 "columns" (ie, vertices), 1 "row", and 1 "slice". There are 5 frames, one for each subject.
Surface Smoothing
mri_surf2surf --hemi lh --s fsaverage --fwhm 5 --cortex\
  --sval lh.ces.mgh --tval lh.ces.sm05.mgh
Notes:
- Full-Width/Half-Max (fwhm) is 5 mm.
- The smoothing is only performed in regions of legitimate cortex (--cortex, which uses the lh.cortex.label).
GLM Fit
This performs a one-sample, group mean (OSGM) just looking for places where the CES is different than 0.
mri_glmfit --y lh.ces.sm05.mgh --surf fsaverage lh \
  --osgm --glmdir lh.ces.sm05.osgm --cortex
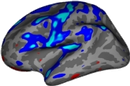
freeview -f \
$SUBJECTS_DIR/fsaverage/surf/lh.inflated:annot=aparc.annot:annot_outline=1:overlay=lh.ces.sm05.osgm/osgm/sig.mgh:overlay_threshold=2,5 \
-viewport 3d


Note that the activation is light because there are only five subjects, but the activation that is there is in the right place.
Group ROI fMRI Analysis
The purpose of this tutorial is to combine individual stats files into one summary table file that can be loaded into a spreadsheet program such as MS Excel or OpenOffice Calc. The individual ROI analyses were performed as described in the Individual fMRI Integration Tutorial. Namely, stats files were created by mri_segstats using no functional contraint, an unsigned (abs) constraint, and a positive (pos) constraint to create stats files in each directory. Furthermore, only 4 segmentations were summarized:
1021 |
ctx-lh-pericalcarine |
1022 |
ctx-lh-postcentral |
1030 |
ctx-lh-superiortemporal |
17 |
Left-Hippocampus |
Measure Volume of Positive Activation in Each ROI
asegstats2table \
  --meas volume \
  --tablefile ces.pos-masked.vol.stats \
  --i fbirn-101/ces.pos-masked.bb.stats \
  fbirn-103/ces.pos-masked.bb.stats \
  fbirn-104/ces.pos-masked.bb.stats \
  fbirn-105/ces.pos-masked.bb.stats \
  fbirn-106/ces.pos-masked.bb.stats
Click here to see the output (ces.pos-masked.vol.stats). Notes:
The values are the volume in mm3 of the ON>OFF voxels whose p-values < .01.
- The value in the first column is just the row number (starting from 0). Normally, the subject name would be here, but the subject name was not specified as input in the above command.
Measure Mean HRF Contrast of Unsigned Activation in Each ROI
asegstats2table \
  --meas mean \
  --tablefile ces.abs-masked.mean.stats \
  --i fbirn-101/ces.abs-masked.bb.stats \
  fbirn-103/ces.abs-masked.bb.stats \
  fbirn-104/ces.abs-masked.bb.stats \
  fbirn-105/ces.abs-masked.bb.stats \
  fbirn-106/ces.abs-masked.bb.stats
Click here to see the output (ces.abs-masked.mean.stats). Notes:
The values are the mean HRF values (raw MR units) of the ON>OFF or ON<OFF voxels whose p-values < .01.
- Some of the values are negative. This is possible because the mask is unsigned (abs).
- In particular, the cross-subject average of Left-Hippocampus is near 0. This is expected because the sensorimotor task should not activate hippocampus.
Measure Mean HRF Contrast of Postiive Activation in Each ROI
asegstats2table \
  --meas mean \
  --tablefile ces.pos-masked.mean.stats \
  --i fbirn-101/ces.pos-masked.bb.stats \
  fbirn-103/ces.pos-masked.bb.stats \
  fbirn-104/ces.pos-masked.bb.stats \
  fbirn-105/ces.pos-masked.bb.stats \
  fbirn-106/ces.pos-masked.bb.stats
Click here to see the output (ces.pos-masked.mean.stats). Notes:
The values are the mean HRF values (raw MR units) of the ON>OFF voxels whose p-values < .01.
- NONE of the values are negative. This is because the mask is positive (pos).
In particular, the cross-subject average of Left-Hippocampus is NOT close to 0 because only positive values were chosen. So, one must be careful how to interpret and draw conclusions from these numbers.
Other multimodal tutorials: A. Multimodal Registration, B. Individual DTI Integration, C. Individual fMRI Integration