|
⇤ ← Revision 1 as of 2018-03-07 15:50:45
Size: 5499
Comment:
|
← Revision 2 as of 2018-03-07 15:52:11 ⇥
Size: 6148
Comment:
|
| Deletions are marked like this. | Additions are marked like this. |
| Line 5: | Line 5: |
| 1. There are 19 clusters | 1. There are 24 clusters |
| Line 15: | Line 15: |
| Eg, the 13th cluster has a pvalue of p<.0002. | Eg, the 13th cluster has a pvalue of p<.002. |
| Line 21: | Line 21: |
| # CreationTime 2017/03/23-18:36:47-GMT # cmdline mri_surfcluster.bin --in lh.gender_age.glmdir/lh-Avg-thickness-age-Cor /sig.mgh --mask lh.gender_age.glmdir/mask.mgh --cwsig lh.gender_age.glmdir/lh-Av g-thickness-age-Cor/cache.th40.neg.sig.cluster.mgh --sum lh.gender_age.glmdir/lh -Avg-thickness-age-Cor/cache.th40.neg.sig.cluster.summary --ocn lh.gender_age.gl mdir/lh-Avg-thickness-age-Cor/cache.th40.neg.sig.ocn.mgh --annot aparc --cwpvalt hresh 0.05 --o lh.gender_age.glmdir/lh-Avg-thickness-age-Cor/cache.th40.neg.sig. masked.mgh --no-fixmni --csd /home/nmrclass/freesurfer/average/mult-comp-cor/fsa verage/lh/cortex/fwhm14/neg/th40/mc-z.csd --csdpdf lh.gender_age.glmdir/lh-Avg-t hickness-age-Cor/cache.th40.neg.pdf.dat --vwsig lh.gender_age.glmdir/lh-Avg-thic kness-age-Cor/cache.th40.neg.sig.voxel.mgh --vwsigmax lh.gender_age.glmdir/lh-Av g-thickness-age-Cor/cache.th40.neg.sig.voxel.max.dat --oannot lh.gender_age.glmd ir/lh-Avg-thickness-age-Cor/cache.th40.neg.sig.ocn.annot --bonferroni 2 --surf w hite # cwd /home/nmrclass/freesurfer/subjects/tutorial_data/buckner_data/tutorial_sub js/group_analysis_tutorial/glm |
# CreationTime 2018/03/07-18:15:40-GMT # cmdline mri_surfcluster.bin --in lh.gender_age.glmdir/lh-Avg-thickness-age-Cor/sig.mgh --mask lh.gender_age.glmdir/mask.mgh --cwsig lh.gender_age.glmdir/lh-Avg-thickness-age-Cor/perm.th40.abs.sig.cluster.mgh --sum lh.gender_age.glmdir/lh-Avg-thickness-age-Cor/perm.th40.abs.sig.cluster.summary --ocn lh.gender_age.glmdir/lh-Avg-thickness-age-Cor/perm.th40.abs.sig.ocn.mgh --annot aparc --cwpvalthresh 0.05 --o lh.gender_age.glmdir/lh-Avg-thickness-age-Cor/perm.th40.abs.sig.masked.mgh --no-fixmni --csd lh.gender_age.glmdir/csd/perm.th40.abs.j001-lh-Avg-thickness-age-Cor.csd --csdpdf lh.gender_age.glmdir/lh-Avg-thickness-age-Cor/perm.th40.abs.pdf.dat --vwsig lh.gender_age.glmdir/lh-Avg-thickness-age-Cor/perm.th40.abs.sig.voxel.mgh --vwsigmax lh.gender_age.glmdir/lh-Avg-thickness-age-Cor/perm.th40.abs.sig.voxel.max.dat --oannot lh.gender_age.glmdir/lh-Avg-thickness-age-Cor/perm.th40.abs.sig.ocn.annot --bonferroni 2 --surf white # cwd /autofs/space/monster_001/users/morgan/tutorial_data/tutorial_data/buckner_data/tutorial_subjs/group_analysis_tutorial/glm |
| Line 38: | Line 25: |
| # hostname nmrclass29 | # hostname monster.nmr.mgh.harvard.edu |
| Line 42: | Line 29: |
| # | # |
| Line 51: | Line 38: |
| # SUBJECTS_DIR /home/nmrclass/freesurfer/subjects/tutorial_data/buckner_data/tut orial_subjs/group_analysis_tutorial # SearchSpace_mm2 75710.8 # SearchSpace_vtx 148175 |
# SUBJECTS_DIR /autofs/space/monster_001/users/morgan/tutorial_data/tutorial_data/buckner_data/tutorial_subjs/group_analysis_tutorial # SearchSpace_mm2 76467.1 # SearchSpace_vtx 149953 |
| Line 58: | Line 44: |
| # Threshold Sign neg | # Threshold Sign abs |
| Line 60: | Line 46: |
| # CW PValue Threshold: 0.05 | # CW PValue Threshold: 0.05 |
| Line 63: | Line 49: |
| # CSD nreps 10000 # CSD simtype null-z # CSD contrast NA |
# CSD nreps 1000 # CSD simtype perm # CSD contrast lh-Avg-thickness-age-Cor |
| Line 67: | Line 53: |
| # Overall max 1.50766 at vertex 37716 # Overall min -12.379 at vertex 41069 # NClusters 19 |
# Overall max 3.62549 at vertex 153106 # Overall min -11.4481 at vertex 134036 # NClusters 24 |
| Line 71: | Line 57: |
| # | # |
| Line 73: | Line 59: |
| 1 -12.379 41069 11218.50 -32.8 -32.1 16.5 0.00020 0.00000 0.00040 24193 -136775.98 insula 2 -12.091 1114 5991.00 -11.9 34.5 26.1 0.00020 0.00000 0.00040 11538 -64281.18 superiorfrontal 3 -8.409 34281 916.85 -13.6 -85.2 5.8 0.00020 0.00000 0.00040 1887 -9482.97 pericalcarine 4 -6.822 108733 872.39 -28.7 -54.5 52.5 0.00020 0.00000 0.00040 1979 -9096.35 superiorparietal 5 -8.037 95822 799.11 -33.8 -44.3 38.3 0.00020 0.00000 0.00040 2186 -10233.78 superiorparietal 6 -6.828 20835 733.60 -58.5 -35.1 38.6 0.00020 0.00000 0.00040 1663 -7701.13 supramarginal 7 -5.977 61660 617.52 -32.6 -76.1 20.8 0.00020 0.00000 0.00040 1157 -5096.85 inferiorparietal 8 -6.806 142120 474.41 -57.9 -38.7 6.0 0.00020 0.00000 0.00040 1147 -5580.88 bankssts 9 -5.467 90409 407.56 -42.2 -67.8 -2.7 0.00020 0.00000 000040 772 -3354.38 lateraloccipital 10 -5.845 130919 322.16 -27.4 -47.7 -5.4 0.00020 0.00000 0.00040 701 -3178.22 lingual 11 -6.651 120331 321.09 -20.3 -67.9 23.8 0.00020 0.00000 0.00040 625 -3016.32 precuneus 12 -6.429 135313 268.70 -43.2 -50.9 10.8 0.00020 0.00000 0.00040 598 -2730.50 bankssts 13 -5.835 157033 201.22 -59.0 -58.0 0.6 0.00020 0.00000 0.00040 360 -1614.40 middletemporal 14 -5.548 81927 147.05 -9.1 -21.2 59.9 0.00200 0.00120 0.00280 346 -1555.27 paracentral 15 -4.918 49292 130.85 -6.1 -68.0 43.2 0.00599 0.00459 0.00739 276 -1163.05 precuneus 16 -4.887 15679 124.65 -46.7 -43.1 -16.6 0.00679 0.00539 0.00838 218 -921.82 inferiortemporal 17 -5.215 1499 121.13 -11.5 -56.8 55.7 0.00778 0.00619 0.00938 276 -1187.77 precuneus 18 -4.482 93754 94.12 -50.1 -54.0 43.2 0.01990 0.01732 0.02247 228 -921.19 supramarginal 19 -4.522 89148 80.14 -26.9 21.6 -13.5 0.03509 0.03174 0.03842 201 -818.25 lateralorbitofrontal |
1 -11.363 136827 5238.31 -49.4 5.9 -16.9 0.00200 0.00000 0.00400 12173 -71953.42 superiortemporal 2 -11.448 134036 3806.78 -11.1 34.5 27.2 0.00200 0.00000 0.00400 7093 -40138.43 superiorfrontal 3 -8.263 95475 1007.77 -20.6 -49.4 -2.3 0.00200 0.00000 0.00400 2031 -11022.29 lingual 4 -8.486 149638 852.93 -36.9 3.1 36.0 0.00200 0.00000 0.00400 1543 -8388.65 caudalmiddlefrontal 5 -8.873 144448 827.08 -43.6 -10.6 50.7 0.00200 0.00000 0.00400 1874 -10019.42 precentral 6 -9.346 38853 726.31 -25.4 -75.9 18.6 0.00200 0.00000 0.00400 1377 -8484.96 superiorparietal 7 -6.468 120934 543.95 -27.6 -79.9 -8.1 0.00200 0.00000 0.00400 857 -4142.81 fusiform 8 -6.427 41007 534.33 -35.5 -86.0 -2.8 0.00200 0.00000 0.00400 783 -3822.02 lateraloccipital 9 -8.207 133346 457.62 -33.0 -36.8 37.5 0.00200 0.00000 0.00400 1379 -7233.24 supramarginal 10 -7.294 10899 403.19 -12.1 -54.9 28.8 0.00200 0.00000 0.00400 882 -4652.63 precuneus 11 -6.609 155919 358.94 -56.8 -38.8 40.2 0.00200 0.00000 0.00400 785 -3846.85 supramarginal 12 -5.358 28451 326.96 -44.1 -66.7 -3.6 0.00200 0.00000 0.00400 578 -2624.22 lateraloccipital 13 -7.965 101082 320.76 -44.4 -50.4 9.2 0.00200 0.00000 0.00400 758 -4005.11 bankssts 14 -5.871 62853 295.50 -52.0 -49.3 -19.0 0.00200 0.00000 0.00400 404 -1973.64 inferiortemporal 15 -7.799 120330 257.77 -20.2 -66.9 24.4 0.00200 0.00000 0.00400 504 -2675.24 precuneus 16 -6.452 80571 226.05 -31.2 34.1 25.6 0.00200 0.00000 0.00400 360 -1768.03 rostralmiddlefrontal 17 -7.584 22284 215.63 -57.7 -11.1 -21.5 0.00200 0.00000 0.00400 370 -1985.30 middletemporal 18 -5.462 81545 163.08 -28.8 -39.1 51.2 0.00200 0.00000 0.00400 358 -1647.86 superiorparietal 19 -5.274 159131 158.42 -10.4 -43.9 41.1 0.00200 0.00000 0.00400 359 -1569.43 precuneus 20 -8.721 38022 112.71 -27.5 28.3 2.1 0.00599 0.00200 0.00997 335 -1973.86 lateralorbitofrontal 21 -5.727 58890 96.36 -5.8 -70.9 41.4 0.01196 0.00599 0.01792 199 -929.47 precuneus 22 -5.166 93755 66.03 -50.1 -54.1 42.6 0.03960 0.02780 0.05132 159 -696.58 supramarginal 23 -4.671 116745 62.80 -39.7 24.5 36.6 0.04547 0.03371 0.05716 110 -474.32 caudalmiddlefrontal 24 -5.132 81927 60.38 -9.1 -21.2 59.9 0.04938 0.03764 0.06104 134 -607.32 paracentral |
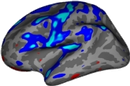
Surface-based Cluster Summary Table as created by mri_glmfit-sim.
- Lines that begin with '#' are comments
- Each data line is a cluster
- There are 24 clusters
- The value in the first column is the cluster number, which allows linking to the annotation.
- Max indicates the maximum -log10(pvalue) in the cluster
VtxMax is the vertex number at the maximum
- Size - surface area (mm^2) of cluster
- Tal(XYZ) is the talairach (MNI305) coordinate of the maximum
- CWP - clusterwise p-value. This is the p-value of the cluster
- CWPLow and CWPHi - 90% confidence interval for CWP
- NVtxs - number of vertices in cluster (each vertex will not have the exact same area, you can estimate mean vertex area by dividing total surface area by the number of vertices)
Eg, the 13th cluster has a pvalue of p<.002.
# Cluster Growing Summary (mri_surfcluster)
# $Id: mri_surfcluster.c,v 1.57.2.3 2016/11/17 18:19:42 zkaufman Exp $
# $Id: mrisurf.c,v 1.781.2.6 2016/12/27 16:47:14 zkaufman Exp $
# CreationTime 2018/03/07-18:15:40-GMT
# cmdline mri_surfcluster.bin --in lh.gender_age.glmdir/lh-Avg-thickness-age-Cor/sig.mgh --mask lh.gender_age.glmdir/mask.mgh --cwsig lh.gender_age.glmdir/lh-Avg-thickness-age-Cor/perm.th40.abs.sig.cluster.mgh --sum lh.gender_age.glmdir/lh-Avg-thickness-age-Cor/perm.th40.abs.sig.cluster.summary --ocn lh.gender_age.glmdir/lh-Avg-thickness-age-Cor/perm.th40.abs.sig.ocn.mgh --annot aparc --cwpvalthresh 0.05 --o lh.gender_age.glmdir/lh-Avg-thickness-age-Cor/perm.th40.abs.sig.masked.mgh --no-fixmni --csd lh.gender_age.glmdir/csd/perm.th40.abs.j001-lh-Avg-thickness-age-Cor.csd --csdpdf lh.gender_age.glmdir/lh-Avg-thickness-age-Cor/perm.th40.abs.pdf.dat --vwsig lh.gender_age.glmdir/lh-Avg-thickness-age-Cor/perm.th40.abs.sig.voxel.mgh --vwsigmax lh.gender_age.glmdir/lh-Avg-thickness-age-Cor/perm.th40.abs.sig.voxel.max.dat --oannot lh.gender_age.glmdir/lh-Avg-thickness-age-Cor/perm.th40.abs.sig.ocn.annot --bonferroni 2 --surf white
# cwd /autofs/space/monster_001/users/morgan/tutorial_data/tutorial_data/buckner_data/tutorial_subjs/group_analysis_tutorial/glm
# sysname  Linux
# hostname monster.nmr.mgh.harvard.edu
# machine  x86_64
# FixVertexAreaFlag 1
# FixSurfClusterArea 1
#
# Input      lh.gender_age.glmdir/lh-Avg-thickness-age-Cor/sig.mgh
# Frame Number      0
# srcsubj fsaverage
# hemi lh
# surface white
# group_avg_surface_area 82220
# group_avg_vtxarea_loaded 1
# annot aparc
# SUBJECTS_DIR /autofs/space/monster_001/users/morgan/tutorial_data/tutorial_data/buckner_data/tutorial_subjs/group_analysis_tutorial
# SearchSpace_mm2 76467.1
# SearchSpace_vtx 149953
# Bonferroni 2
# Minimum Threshold 4
# Maximum Threshold infinity
# Threshold Sign    abs
# AdjustThreshWhenOneTail 1
# CW PValue Threshold: 0.05
# Area Threshold    0 mm^2
# CSD thresh  4.000000
# CSD nreps    1000
# CSD simtype  perm
# CSD contrast lh-Avg-thickness-age-Cor
# CSD confint  90.000000
# Overall max 3.62549 at vertex 153106
# Overall min -11.4481 at vertex 134036
# NClusters          24
# FixMNI = 0
#
# ClusterNo  Max   VtxMax   Size(mm^2)  MNIX   MNIY   MNIZ    CWP    CWPLow    CWPHi   NVtxs    WghtVtx   Annot
   1      -11.363  136827   5238.31    -49.4    5.9  -16.9  0.00200  0.00000  0.00400  12173   -71953.42  superiortemporal
   2      -11.448  134036   3806.78    -11.1   34.5   27.2  0.00200  0.00000  0.00400   7093   -40138.43  superiorfrontal
   3       -8.263   95475   1007.77    -20.6  -49.4   -2.3  0.00200  0.00000  0.00400   2031   -11022.29  lingual
   4       -8.486  149638    852.93    -36.9    3.1   36.0  0.00200  0.00000  0.00400   1543    -8388.65  caudalmiddlefrontal
   5       -8.873  144448    827.08    -43.6  -10.6   50.7  0.00200  0.00000  0.00400   1874   -10019.42  precentral
   6       -9.346   38853    726.31    -25.4  -75.9   18.6  0.00200  0.00000  0.00400   1377    -8484.96  superiorparietal
   7       -6.468  120934    543.95    -27.6  -79.9   -8.1  0.00200  0.00000  0.00400    857    -4142.81  fusiform
   8       -6.427   41007    534.33    -35.5  -86.0   -2.8  0.00200  0.00000  0.00400    783    -3822.02  lateraloccipital
   9       -8.207  133346    457.62    -33.0  -36.8   37.5  0.00200  0.00000  0.00400   1379    -7233.24  supramarginal
  10       -7.294   10899    403.19    -12.1  -54.9   28.8  0.00200  0.00000  0.00400    882    -4652.63  precuneus
  11       -6.609  155919    358.94    -56.8  -38.8   40.2  0.00200  0.00000  0.00400    785    -3846.85  supramarginal
  12       -5.358   28451    326.96    -44.1  -66.7   -3.6  0.00200  0.00000  0.00400    578    -2624.22  lateraloccipital
  13       -7.965  101082    320.76    -44.4  -50.4    9.2  0.00200  0.00000  0.00400    758    -4005.11  bankssts
  14       -5.871   62853    295.50    -52.0  -49.3  -19.0  0.00200  0.00000  0.00400    404    -1973.64  inferiortemporal
  15       -7.799  120330    257.77    -20.2  -66.9   24.4  0.00200  0.00000  0.00400    504    -2675.24  precuneus
  16       -6.452   80571    226.05    -31.2   34.1   25.6  0.00200  0.00000  0.00400    360    -1768.03  rostralmiddlefrontal
  17       -7.584   22284    215.63    -57.7  -11.1  -21.5  0.00200  0.00000  0.00400    370    -1985.30  middletemporal
  18       -5.462   81545    163.08    -28.8  -39.1   51.2  0.00200  0.00000  0.00400    358    -1647.86  superiorparietal
  19       -5.274  159131    158.42    -10.4  -43.9   41.1  0.00200  0.00000  0.00400    359    -1569.43  precuneus
  20       -8.721   38022    112.71    -27.5   28.3    2.1  0.00599  0.00200  0.00997    335    -1973.86  lateralorbitofrontal
  21       -5.727   58890     96.36     -5.8  -70.9   41.4  0.01196  0.00599  0.01792    199     -929.47  precuneus
  22       -5.166   93755     66.03    -50.1  -54.1   42.6  0.03960  0.02780  0.05132    159     -696.58  supramarginal
  23       -4.671  116745     62.80    -39.7   24.5   36.6  0.04547  0.03371  0.05716    110     -474.32  caudalmiddlefrontal
  24       -5.132   81927     60.38     -9.1  -21.2   59.9  0.04938  0.03764  0.06104    134     -607.32  paracentral